Introduction
Since not everyone can afford to have licensed Minitab or JMP, but how can we apply some of the common quality tools?
In this post, summarized illustration of how to setup Process Capability, Control Chart and Gage R&R (XBar-R Method) will be presented.
Process Capability (Cpk) Setup
After calculating the required parameters, then plot it on Excel to demonstrate the distribution curve along with the bins.
Quantitative Control Chart Setup
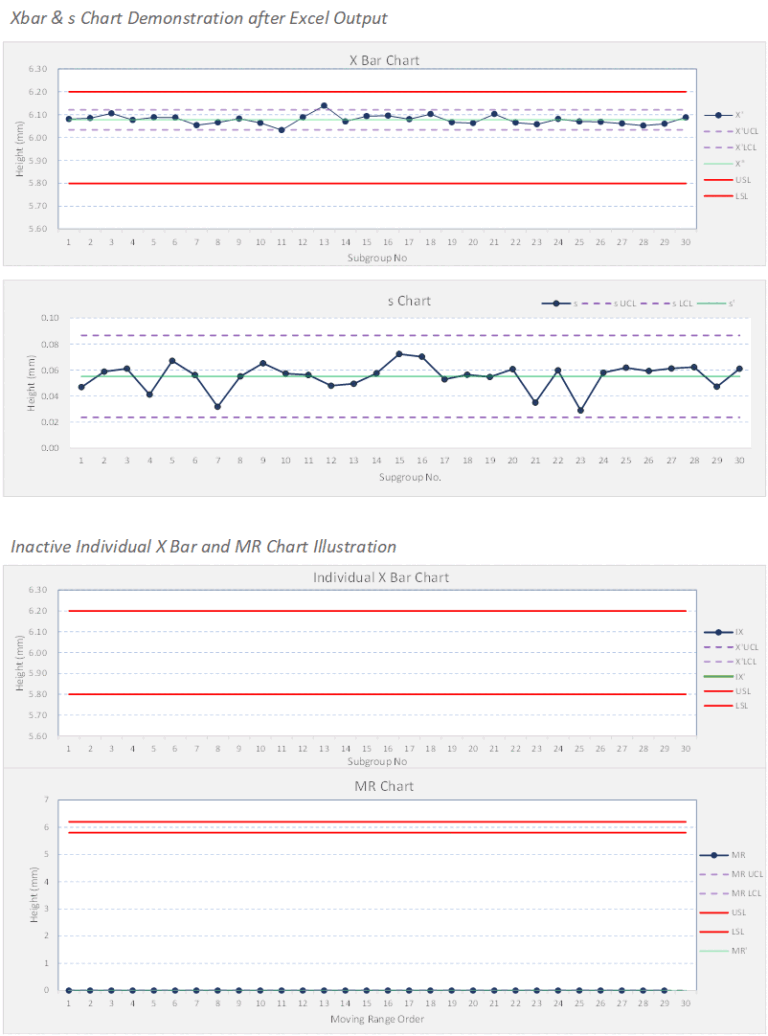
The following are the demonstration what input should be entered for the automated quantitative control chart.
After the setup page, the data input is also critical to setup the control chart. The following graphs will demonstrate how data are entered and the respective control limit calculation.

Attributive Control Chart Setup
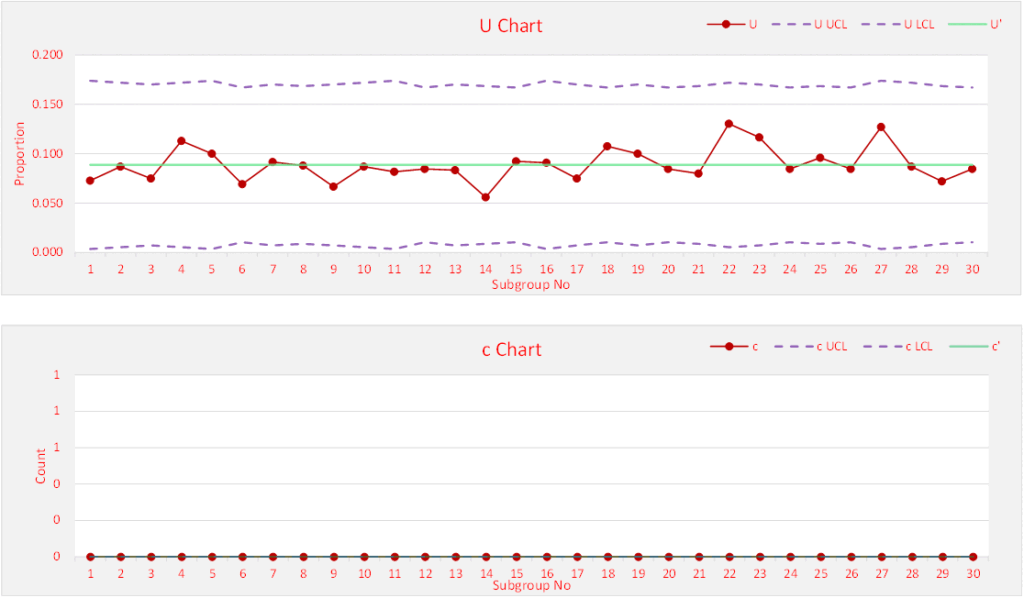
The following are the demonstration what input should be entered for the automated attributive control chart.
After the required setup, the following would be the control chart demonstration for attributive control chart.

