Introduction
Measurement System Analysis (MSA) helps to evaluate measurement system’s effectiveness and suitability, while identify major variance indicator which impacts the measurement system are part to part variation and the variation within the measurement system itself.
In measurement system, accuracy (variance coming from measuring value and true value) and precision (variance coming from measuring repeatedly with the same gauge for same part) are two critical indications of the measurement system’s effectiveness. The following graph indicate the possible situation with the measurement system.

In general, 5 elements inside measurement system shall be considered:
- Constant relationship between output variable and input variable as changes occur.
- Systematic error of measurement, is the difference between observed average of measurements and reference value.
- Variance coming from measuring instrument equipment, or performed via the same operator with the same gauge to measure repeatedly.
- Systematic variance coming from different operators using the same gauge to measure.
- Ability of measuring system to maintain constant metrological characteristics over time.
Gage R&R
But in order to analyze the critical indicators of system, Gage R&R (Repeatability & Reproducibility) is commonly used in the industry for the following purposes:
- Comparing process variance with measurement system variance.
- Comparing product characteristic’s specification limit with measurement system variance %.
- Appraiser variance’s contribution with respect to measurement system variance.
- Can measurement system identify individual measured parts?
Prior to evaluating the measurement system, the process map below will give a general layout of respective steps before giving the final evaluation regarding your measurement system.

In Gage R&R, there are 4 types which can be referred for the industry. And the following table summarizes the definition and respective acceptance criteria.
In addition, the examples for each gage R&R will be listed.

Type I Gage R&R
Type I study helps observer to evaluate respective gauge’s repeatability (Cg) and bias (Cgk), these 2 types of indicators can help to analyze gauge consistency and correctness of the gauge.
Calculated equation is given below:

Example for type I calculation is given below:
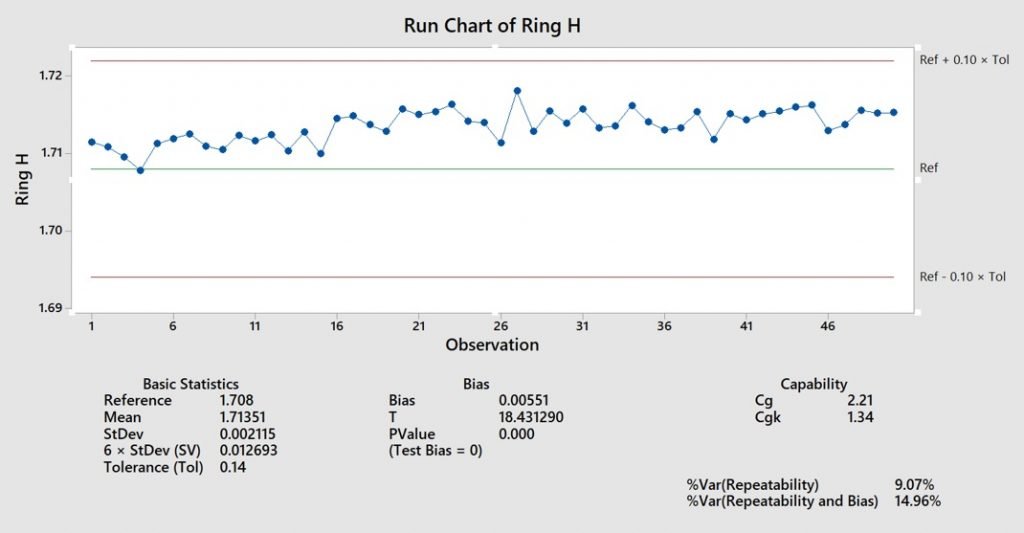
One of the inspection gauge’s length results has a measuring average of 1.71351 mm with a standard deviation of 0.002115 mm, while the reference value for the gauge indicated 1.708 mm. The specification tolerance is ±0.07 mm.

The calculated results indicated that Cg and Cgk exceeds both 1.33 (min value), these 2 indicator shows that the gauge is capable to measure repetitively and has high accuracy for reading value. The following control chart is the summarized example for the Cg/Cgk plotting.
Type II Gage R&R
MSA’s type II study is applied when measurement system will be influenced by both appraiser variance (different operator) and equipment variance. It also will consider the part to part variance within the system. In general, the minimum sample size shall be at least 30 (10 non-destructive different samples measured for at least three times, each time is measured by different operator) to have close to the normal distribution.
For the example demonstrated below, 4 different operators measured 10 different samples for at least 5 times. Therefore 200 data points (4 x 10 x 5) were collected to analyze measurement system’s gage R&R, and the results running from JMP can provide us the following explanation.
In this variability chart, it demonstrates 4 operator’s average value and standard deviations within each sample.

The Gage R&R mean plot demonstrates the average measurement per operators or per parts (based on the amount of measurements repeated)

Lastly by looking at the overall gage R&R along with number of distinct categories. The system and operator is maintaining an ideal condition to identify different parts while performing accurate measurements.

Type III Gage R&R
MSA’s type III study is applied when measurement system will be influenced by only equipment variance. It also will consider the part to part variance within the system. In general, the minimum sample size shall be at least 30 (10 non-destructive different samples measured for at least three times, each time is measured by same operator) to have close to the normal distribution.
For the example demonstrated below, same operator measured 10 different samples for at least 5 times. Therefore 50 data points (1 x 10 x 5) were collected to analyze measurement system’s gage R&R, and the results running from JMP can provide us the following explanation.
In this variability chart, it demonstrates particular’s average value and standard deviations within each sample.

The Gage R&R mean plot demonstrates the average measurement per operatoror per parts (based on the amount of measurements repeated)

Lastly by looking at the overall gage R&R along with number of distinct categories. Operator is able to identify different parts while performing consistent measurements.
Attributive Gage R&R
Attributive MSA helps to analyze attributive results (PASS/FAIL) for evaluating whether the system is judging the attributive characteristics correctly. the judgement correctness, κ (Greek: Kappa) will be used to calculate the judgement correctness level.
The equation for Kappa calculation when there’s only binary result judged by two different personnel is given below

The two judgement results by two different personnel example is given below:

When there are equal or more than three results and 2 evaluators. Then the Kappa value shall be calculated with quadratic weighting.

The following example demonstrates when four evaluators determine 20 samples while verifying if the evaluation system is robust and consistent.


By looking at the overall Kappa value, the evaluation system between 4 evaluators are close to perfect match. Although improvement can still be done to make sure close to 100% correct evaluation.
2 Comments
Join the discussion and tell us your opinion.
The different types 1 – 3 and attributes, is this driven by a Std. such as AIAG? We got a customer asking for only a Type 1 and Type 3 only reports.
Hello Charles, it is referred from the ASQ definition alongside some other countries’ quality standard definition for measurement variances. The measurement system’s nature will dictate what type you will be applied for.
Type 1 is to generally make sure your gauges are within compliance when verifying with your reference standard. And I assume type 3 is mostly due to only one operator or one gauge is available to obtain your data, that is why your customer wants to see only the repeatability result. Otherwise it would be Type II due to the fact different measuring instrument along with different operators would cause cross variation. I hope this clarifies some question from your side.