Introduction
Statistical Process Control (SPC) is used in the manufacturing industry for the following purpose:
- Ensure process is stable and predictable.
- Enhance product quality, production capacity and reduce cost.
- Collect reference data for production process analysis.
- Differentiate regular and special causes for corrective action & preventive action establishment guideline.
SPC control chart determines the current or improved processes’ control state while evaluating data point trend, and the control chart can be defined as either quantitative (continuous) or attribute (discrete) control chart based on the data you collected.
The following chart will illustrate which control chart is suitable based on data type:

Before establishing control chrat, the following steps can be considered to establish control charts.

Quantiative Control Chart
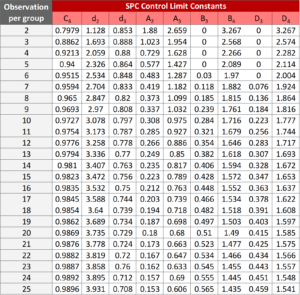
Quantitative control chart is applicable for continuous data with different sample size per group. Please refer to the following summary and control limit calculations for each quantitative control chart type.


The following tables and definition explains respective SPC quantitative control chart’s definition.
Quantitative Control Chart Examples:
This X Bar R chart demonstrates the rubber thickness’ trend chart where each date is considered as a subgroup (5 measured values per subgroup).
In addition, the control chart is split into 2 phases where February and March 2023 are identified to monitor the trend on monthly basis.

This X Bar s chart demonstrates the rubber thickness’ trend chart where each date is considered as a subgroup (10 measured values per subgroup).
In addition, the control chart is split into 2 phases where February and March 2023 are identified to monitor the trend on monthly basis.

This X MR chart demonstrates the Melting Point for chemical where each data point were measured individually.
In addition, the control chart is split into 2 phases where February and March 2023 are identified to monitor the trend on monthly basis.

Process Capability
In addition to control chart, process capability is also applicable to evaluate whether process variance is within robust and consistent state where samples collected are within the same subgroup.
The following elements and roadmap are considered to calculate process capability.

- Indicate how accurate/close the sample mean is with respect to specification mean.
- Indicate process consistency while verifying variances within the process.
- Cumulative calculation of process capability from both Ca and Cp.
- Process Capability based on one sided specification only (primary for upper spec limit).
- Process Capability based on one sided specification only (primary for lower spec limit).
The following example is to verify a process’ product dimension to see whether the process is stable or not.

By looking at the overall Ppk, the process seems to be consistent. But when looking at the distribution, the process was mostly on the lower side of the specification. Therefore the precision and accuracy (when specification median value applies) shall ALSO be considered before using Ppk to make conclusion for process consistency.